ML-driven Alpha Search and Alpha Allocation on Large Scale Part III: Enhanced Alpha Search Allocation on Large Scale

Summary of the talk given at the Bloomberg Quantamental Exchange 2023
The series on the topic ‘ML-driven Alpha Search and Alpha Allocation on Large Scale’ consists of the following 3 sections.
Part 1: Recent Trends in Machine Learning
Part 2: Alpha Search on Large Scale
Part 3: Enhanced Alpha Search and Strategy Allocation on Large Scale
In this section, we will explore additional considerations for alpha search and to methods to find alpha allocation strategy on large scale
Additional Considerations for Alpha Search
Although we can mark the process of finding an alpha on large scale as complete, we thought about possible improvements that can be made to the generative models upon evaluation.
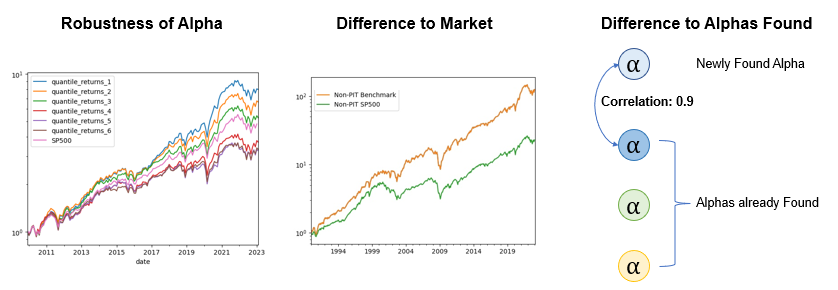
1) Robustness of Alpha: How well does a factor explain future portfolio returns?
2) Statistical Difference to Market Return: To what extent is the risk-return profile of the factor statistically different from the market return?
3) Statistical Difference to the Alphas already found: To what degree is the factor statistically different from the alphas that have been previously found?
Concepts from Reinforcement Learning
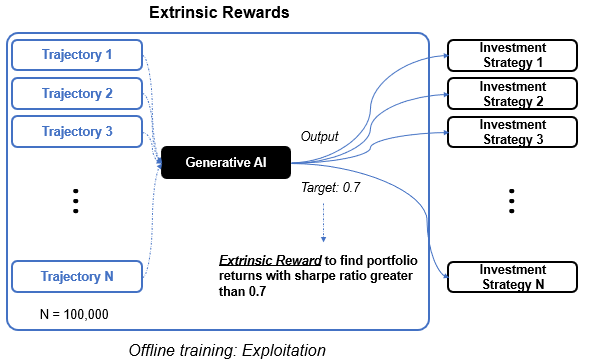
This is where the concept of extrinsic and intrinsic rewards come into play. So far we have only considered the extrinsic reward, a reward signal that is defined by the task. That is, the models are trained offline to exploit the task of finding a factor portfolio with sharpe ratio of greater than 0.7
We can introduce a notion of intrinsic rewards, additional rewards for finding novel alphas that are both statistically different from the market return and the alphas that have been already found. This can be done during an online inference where more reward is given to an output portfolio that has a greater t-statistic value with respect to market return, and more rewards that make use of mathematical operators and company fundamentals that have not been used in the formulation of the previously found alphas.
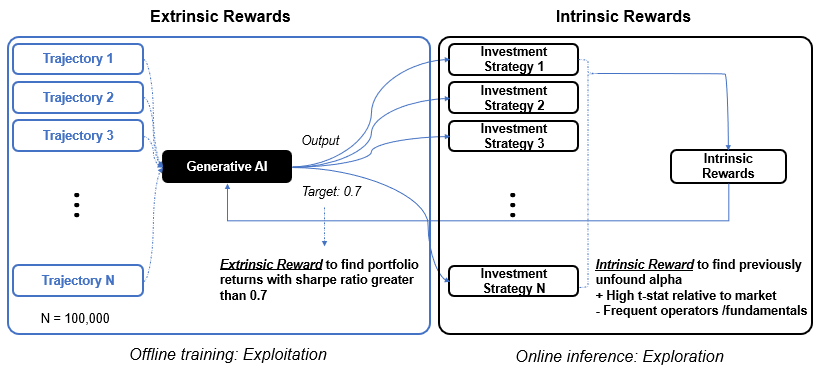
By combining generative models and reinforcement learning and by introducing the concept of offline learning with extrinsic rewards and online inference with intrinsic rewards, one can create a unified framework that has the capability to find alphas on large scale.
From Alpha Search to Alpha Strategy Generation
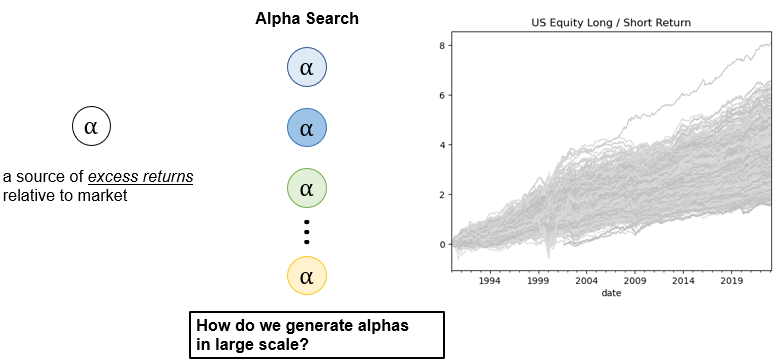
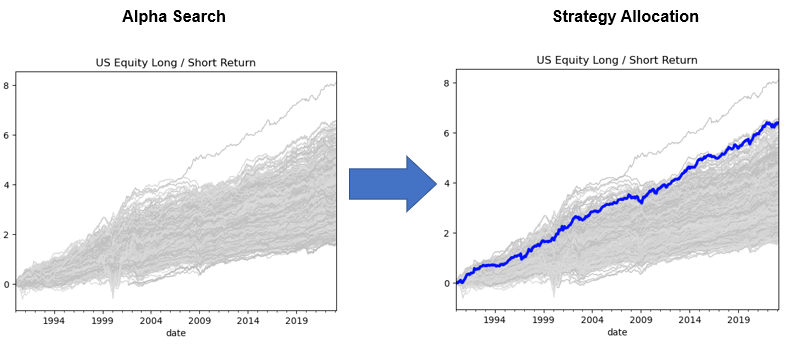
We have thus far explored ways to find alphas over multiple computing cores and have found sufficient number of alphas as represented by each gray line shown on the graph on the right-hand side of Figure 21.
We now want to move onto strategy generation. To elaborate I want to talk about how to combine alphas together, how one can assign an optimal weight to each alpha to create a final investment portfolio and a winning investment strategy.
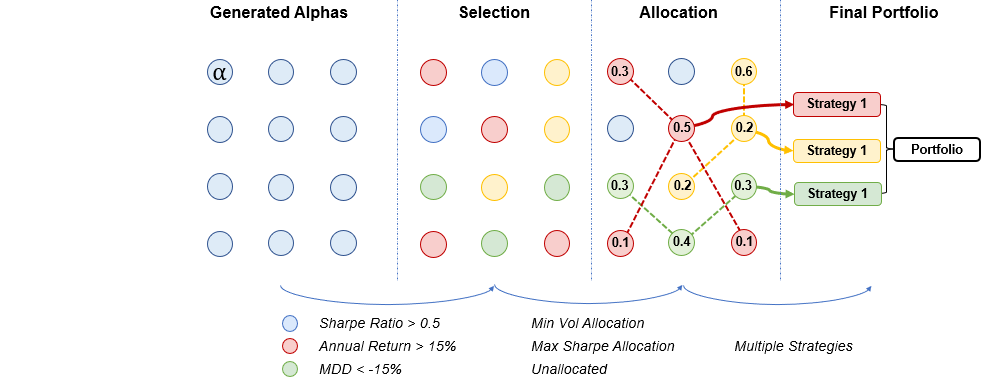
Conventional Allocation Strategy
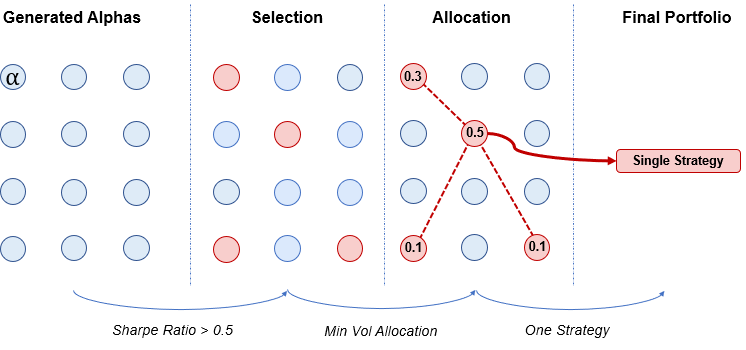
With reference to Figure 23, a typical allocation strategy involves a few steps, starting with the determination of a portfolio metric from the factors generated by the generative models, followed by the identification of an optimal allocation strategy such as momentum or risk parity. Once an allocation strategy is chosen, a weight is assigned to each normalized alpha, and the sum of these weighted alphas is used to construct the final portfolio.
Backtest Insight
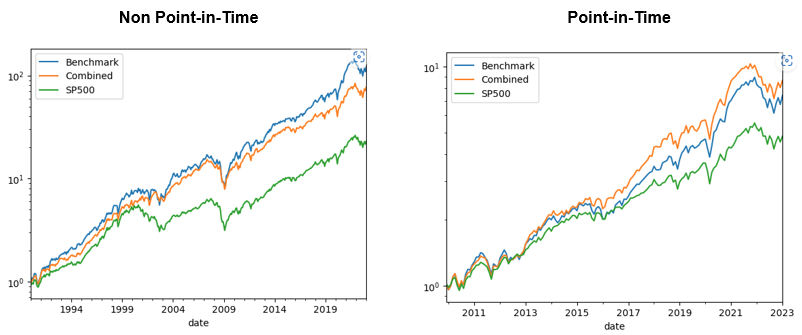
Observation 1: Disparity between Non PIT and PIT Results
During our attempts to create a precise back test simulation, we noticed some significant differences between non point-in-time and point-in-time results. The graph on the left-hand side shows the simulation result by combing all factors that had a portfolio with sharpe ratio greater than 0.5 as of December 2022. Referring to Figure 24, the graph on the right-hand side shows the result by calculating the sharpe ratio of the portfolio every month. At each month we, therefore, combine different factors according to the sharpe ratio calculated at that precise point-in-time and decide whether the factor was considered as alpha at that time.
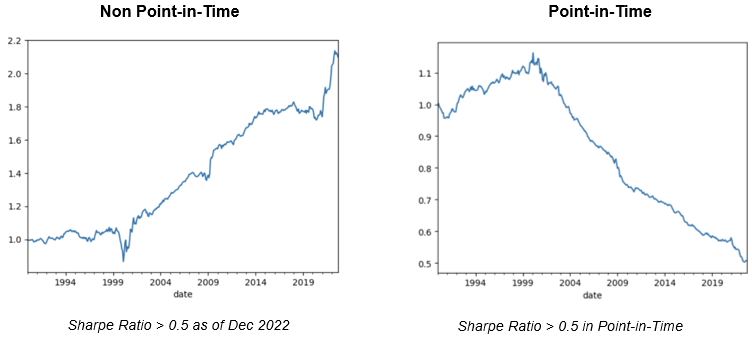
There are two potential reasons for the apparent decrease in the performance in point-in-time. One plausability reason is that there is a tendency for the alphas to revert to mean in the long run. Another possibility is that the sources of excess returns are becoming more available for quantitative researchers to find and therefore decaying much faster than we think.
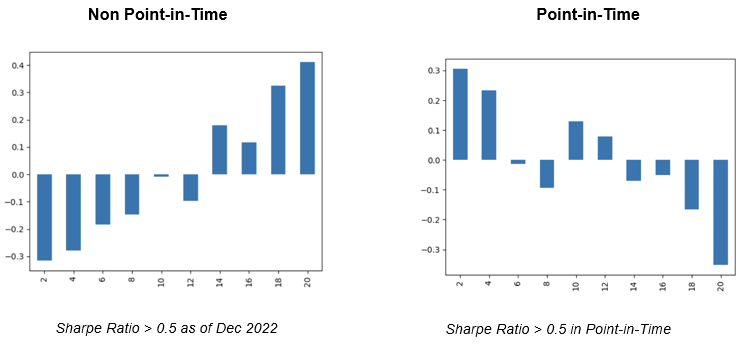
We also observed a notable contrast between non point-in-time and point-in-time results when examining the quantile returns of the combined factors selected as of December 2022 versus those selected every month in point-in-time. The graphs in Figure 25 shows the plot of average returns (on y-axis) of different quantiles of an allocation strategy (on x-axis). Although the hierarchical allocation of alphas with a Sharpe ratio greater than 0.5 demonstrated robustness in non point-in-time, with higher quantile yielding greater average returns, the point-in-time results showed the complete opposite, demonstrating the strategy as rather a sub par.
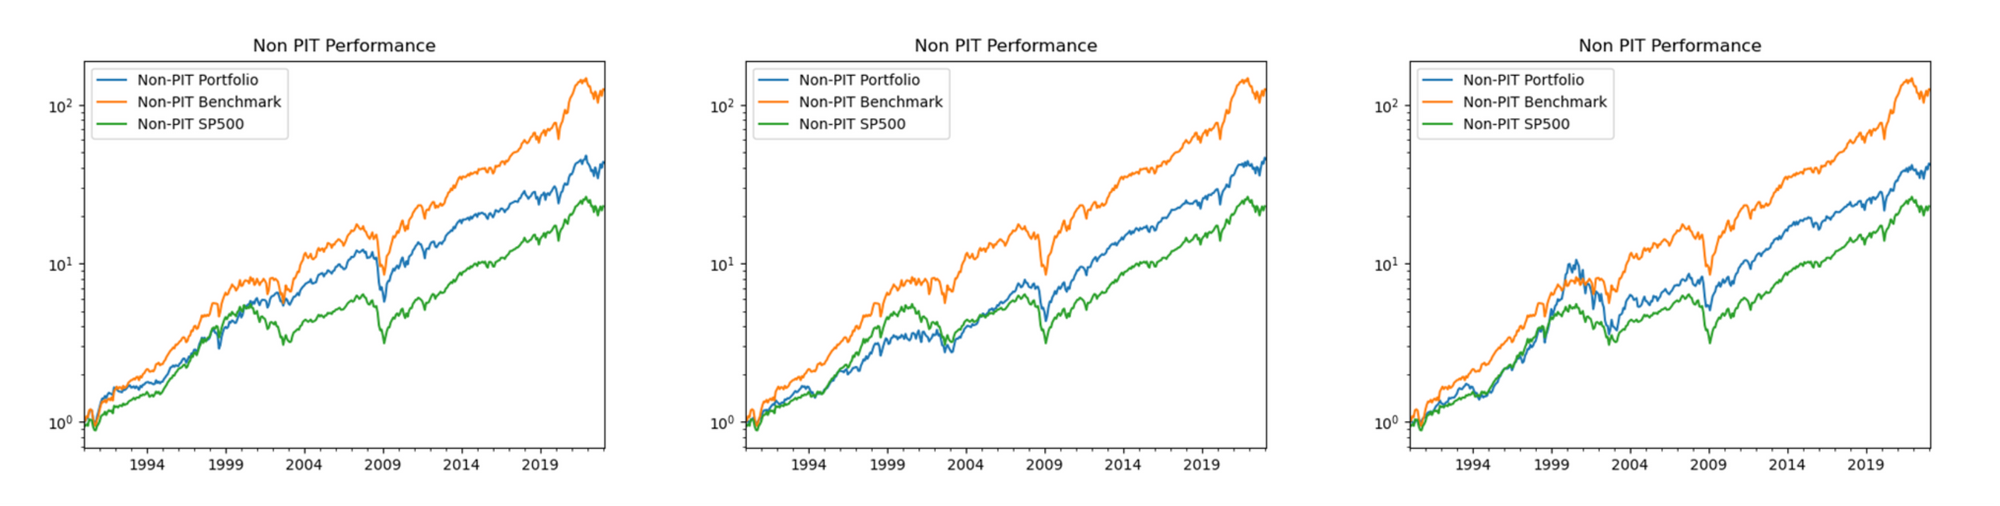
Observation 2: Allocation Methods are Good but not Dominant
Our back test simulation of different allocation algorithms revealed that while individual strategies can perform well, no single strategy emerged as dominant. This is especially true when we look at the graph with the 3rdstrategy (in blue) showing a strong result between 1999 and 2001 and the 2ndstrategy producing a strong result in 2022. Out-performance of each investment strategies (in blue) are different for differnet periods of time and therefore have various risk-return profiles that are good but not necessarily dominant.
Insight from Observations
The lessons from point-in-time simulations and backtest of multiple practical allocation algorithms all the whilst trying to avoid over-fitting of the data have encouraged me to explore the application of generative AI. In this case, models are encouraged to find the right selection of the alphas and search for the appropriate strategy allocation of the alphas to find diverse yet optimal ways to yield multiple investment strategies that can cover ideal results in different time periods.
So far we have found more than 100 different investment strategies including those that explore various ways of forming a cluster of alphas and finding allocation strategies within and amongst the clusters. As a result, we are able to achieve robust results both in non point-in-time and point-in-time simulations accomplishing higher sharpe ratio with lower volatility than a single benchmark allocation strategy.
To conclude, I hope that I have made a coherent case of exploring generative AI and reinforcement learning and their application to data-driven investment.
For those of you interested in learning more about our technology, our funds and our company please refer to the following link. Please do not hesitate to email me at jin[dot]chung[at]akrostec.com for any questions on the presentation.
Thank you for your time and for those who are interested in learning more about Akros Technologies, you can contact us via email and here are a few links you could refer to!