Building a cost-effective on-premise AI research infrastructure on Kubernetes
Engineer’s nightmare
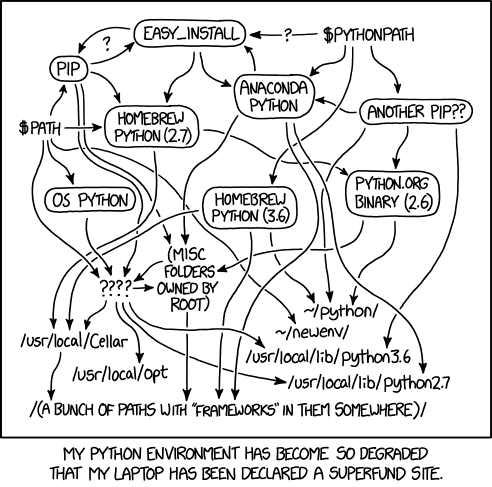
At one point, as engineers, we’ve all had experiences of messing things up accidentally. Whether it be breaking team virtual environments or making fat-fingered the taboo terminal commands, they are always unexpected and deeply distressing. While accidents can happen, it’s crucial to systematically prevent them to minimise the risk & damage.
# Never try the below commands, it will erase your system.
echo "I can brick my system. Hold my beer!"
sudo rm -rf / --no-preserve-root
Introduction
Just like in software engineering, when it comes to AI quantitative research, it is essential to have a consistent and reproducible system environment to be on an exciting journey to validate hypotheses and develop successful models. Experiments always start small jobs but as they get more complex, they require more flexibility on a number of operation environments, together with variant hardware requirements (CPU/GPU/RAM).
So, in order to lubricate our researchers’ workflow while preventing technical accidents, we made a decision to migrate our old legacy architecture to Kubernetes!
By migrating to Kubernetes we expected the following benefits:
- No more ‘It worked on my machine!’ excuses
- Easily manage and request computing resources of multiple on-prem servers within a single cluster
- Painlessly scale-out new computing resources by adding a new worker node (Either cloud or on-prem server)
- All common research frameworks & libraries from light to heavy are pre-installed and built as a ‘containerd’ image so researchers can focus solely on their research.
- No more dependency mess or package mismatch! Just get yourself a new cosy environment while preserving all your work.
In this post, I will briefly go over how we built an in-house RKE2 Kubernetes cluster to provide isolated research environments as well as easy-to-use resource managing & service deploying platforms.
Background
In case you are not familiar with Kubernetes, it is an open-source container orchestration system that smartly automates the processes involved in scheduling & managing thousands of containers across a fleet of machines. It has been an open-source project since 2014 and is managed by CNCF.
In Kubernetes, a master node provides overall management and controls the worker nodes in a cluster. It is responsible for resource allocation, scheduling, monitoring and state maintenance.
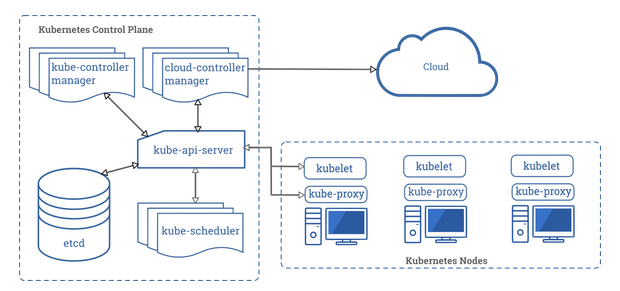
Minimum definitions of main components in a master node and a worker node are as below.
Master node (Control plane)
- kube-apiserver: Frontend for K8s control plane, exposes Kubernetes API
- etcd: Backing store for all cluster information (data)
- kube-scheduler: Watches pods and schedules them to node
- kube-controller-manager: Controls node, job, endpoints, service accounts & tokens
- cloud-controller-manager: Deals with cloud-specific control logic
Worker node
- kubelet: Agent on each node that ensures containers are running in a pod
- kube-proxy: Network proxy that implements Kubernetes ‘Service’ concept
- container-runtime: Software to run containers, Kubernetes supports containerd & CRI-O
Infrastructure Overview

In order to separate the master node taking the cost into consideration, we have decided to use an Amazon EC2 instance as our control plane, instead of using Amazon EKS Anywhere, which was also a possible option for managing our self-managed on-premises infrastructure.
Akros Technologies’ network contains individual computers and different types of servers as shown in the diagram above. First of all, with the in-house DNS Server, we enabled human-friendly URLs that replaced bare IP addresses for the convenient usage of researchers. Since our master node was migrated to the cloud, we had an OpenVPN Access Server installed on our corporate network to allow worker nodes to join the party.
Using the EC2 instance as the OpenVPN Linux client, the entire VPC shares the VPN tunnel connection to reach the OpenVPN Access Server at our server rack. As a result, we can access the servers on the AWS VPC as if they are resources from a local network.

Internal tools we built
To take full advantage of the aforementioned RKE2 cluster, a few internal tools were developed so that researchers can easily get what they want (Yes, more and more GPUs).

Akros Resource Manager
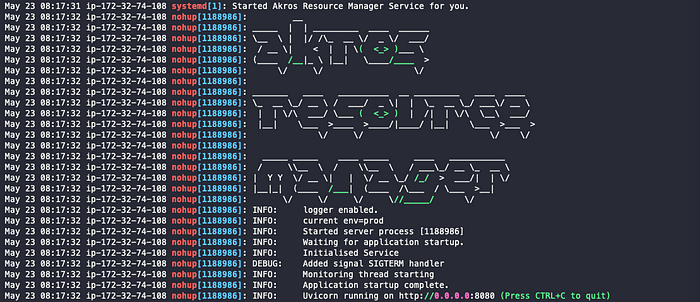
Akros Resource Manager is a REST API server that directly communicates with the RKE2 cluster through the Kubernetes Python Client. It is responsible for continuously monitoring, managing, and analysing our K8s cluster. It handles a bunch of service deployments, and research resource requests from our Slack API and service dashboard.
Also, a monitoring thread within the manager constantly polls and records the overall CPU & RAM usage and notifies the users by sending a POST request to the Slack API when they are heavily under-utilising the allocated resource.

Slack API
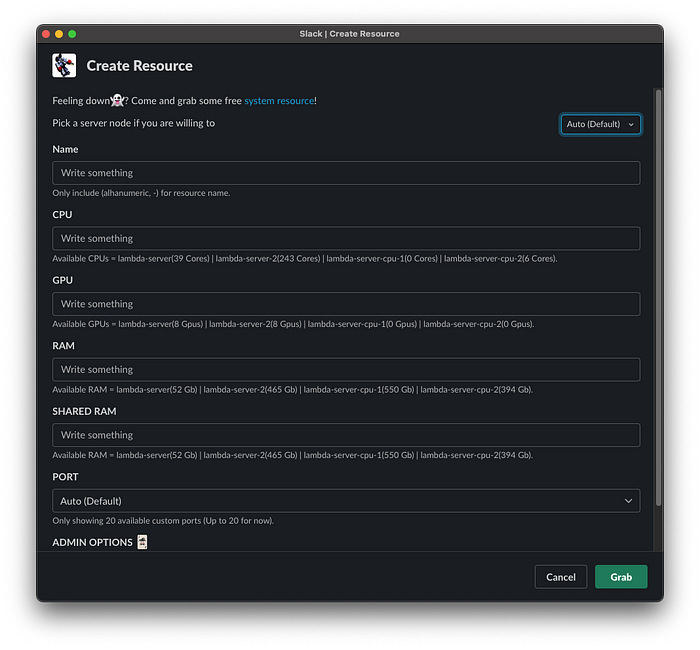
By utilising bolt-python, we have developed an in-house Slack app that works as a front-end to the resource manager. Starting from a simple auth setup through Slack slash commands, it handles all kinds of messages, buttons, and modal interactivity on Slack! With the help of bolt-python, our researchers are able to create & remove environments in just a few seconds!
Polling API
This is a simple polling API that constantly monitors the number of auto-inference replicas by asking the resource manager the currently available amount of resources. The polling API then adjusts the number of auto-inference replicas according to the current resource status. So when someone takes more resources, it immediately lowers the number of auto-inference replicas in the K8s cluster.
Service Dashboard
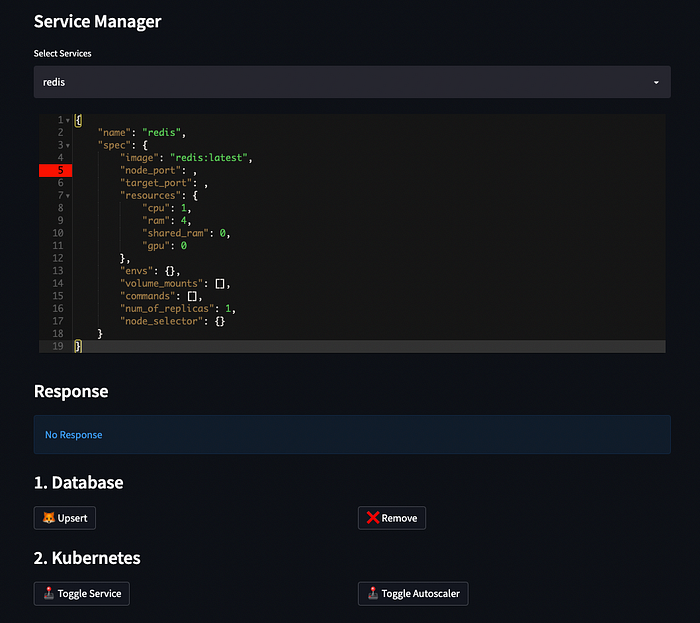
Our service dashboard was built on top of Streamlit to manage and deploy our in-house services to the cluster. Using the JSON editor we can deploy new services just by filling the necessary specs including name, image URL, ports, resources, volumes, commands, HPA and other Pod/Deployment specs.
Challenges we faced before
Getting into too much detail about all the challenges we faced is out of the scope of this post, however, I will shortly go over a few of them below.
CPU throttling problem
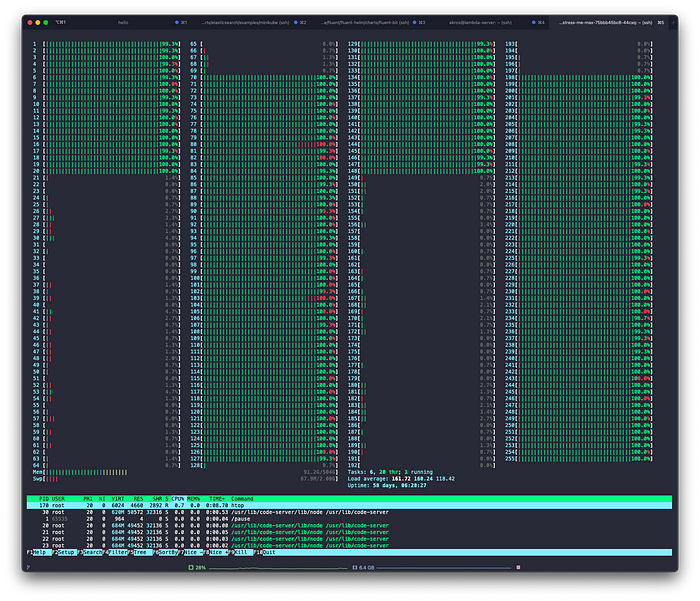
When we previously ran our auto-inference system, we faced a severe CPU throttling as the auto-inference system tried to use all available resources (i.e not considering hyper-threading performance degradation). This was simply resolved by setting an upper limit to assign fewer resources. However, we soon faced another type of CPU throttling.
By default, kubelets on each worker node use CFS (Completely Fair Scheduler) quota to enforce pod CPU limits. Because of this, all the containers which used up the quota rather too quickly were throttled for the rest of the given period. In normal cases, the scheduled workloads spread out to different CPU cores and work without much intervention, however it was critical to our system that most pods are heavily CPU-intensive.
To avoid CPU throttling, we set the Kubernetes CPU-manager-policy to static to allow pods to be granted increased CPU affinity such that any integer number, CPU requests remained reasonable requests to CPUs on the node. By switching from CFS quota to cpuset controller, we were no longer suffering from CPU throttling.
Inter-node communication problem
To migrate the master node from a local server to AWS, we had to restore an etcd snapshot(backup) to the new node on top of OpenVPN. After migration, the cluster information was successfully restored, however, we were soon confronted with a problem — master node pods could not connect to worker node pods.
In Kubernetes, a CNI plugin is responsible for inserting a network interface to the containers’ network namespaces so they can communicate with each other. Overlay networks then encapsulate network traffics with a virtual interface like VXLAN.

RKE2 uses the Canal CNI plugin by default and it uses Flannel for inter-node traffic and Calico for intra-node traffic. Since our problem was inter-node, we looked into kube-flannel logs and identified flannel was not selecting the right interface. Considering the fact that the master node is connected to our corporate VPN server, we had to manually adjust the flannel to select the tunnelling interface tun0 instead of eth0 on the canal ConfigMap then phew… that cleared up!

Conclusion
Thank you for reading and hope you enjoyed this article!
If you have built anything similar or encountered similar issues, please share your experiences in the comments below!
Akros Technologies is also hiring! If you want to be part of our team and solve exciting problems make sure you visit us on the career page and follow us!